|
MTF and HO MTF |
  
|
|
MTF and HO MTF |
|
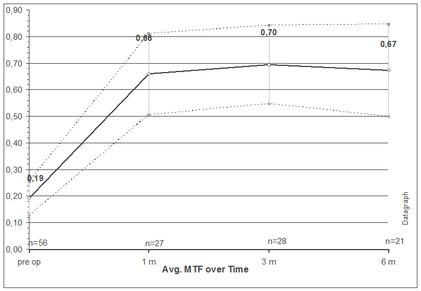
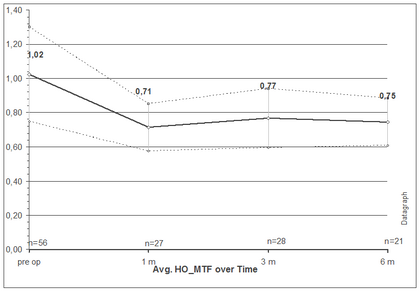
Some aberrometers calculated the Modulation Transfer Function which is a sort of objective contrast sensitivity plot. In order to calculate and graph average values over time the area ratio comparing area (integral) under the total or HO MTF curve with a Best MTF reference curve has to be available. See your Aberrometer's manual for details. Datagraph plots the values entered on the aberrations tab in the MTF columns.