|
Coma |
  
|
|
Coma |
|
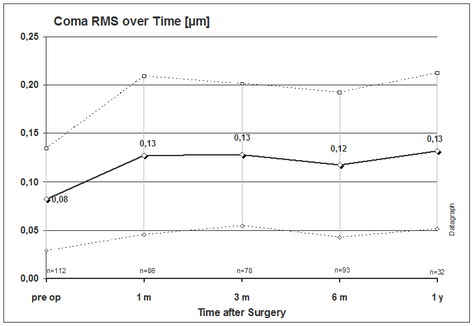
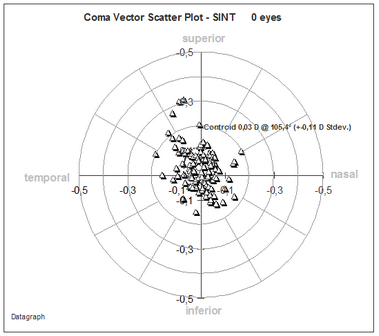
Similar to HO RMS the Coma Terms Z7 and Z8 can be plotted as RMS magnitude over time. This shows whether coma as been induced or reduced on average. But since coma is a vector similar to astigmatism it should be seen as a magnitude + axis scatter plot. Unlike the astigmatism axis the coma plot axis is not doubled since its range goes from 0 to 360°.
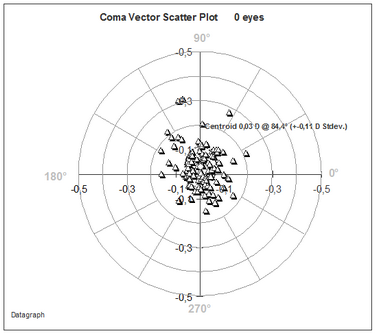
Coma may have a mirror symmetry for OS and OD and we recommend to use a normalized coma vector scatter plot looking at nasal-temporal distributions rather than using the actual axis.