|
Graphs |
  
|
|
Graphs |
|
Datagraph-med allows to display graphs immediately after entering data and a variety of filters allow to see and compare results of certain patient groups.
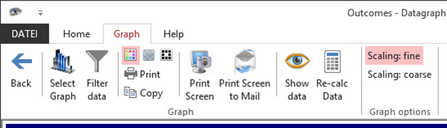
The ribbor bar changes when you click on the 'Graphs' icon on the main menu.
Click on Select Graph and Filter Data to display the desired graph from a selection of patients. Without making any selections graphs show 1 and 3 month data for a myopic patient group.