|
Filter Settings for Graphs |
  
|
|
Filter Settings for Graphs |
|
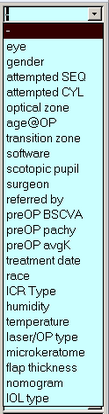
The data which is actually shown on individual graphs can specified via the 'Data Filter Settings' pop-up window. There are four fixed filter criteria ('month', 'groups', 'refraction type', and 'surgery type' - marked in yellow) and four additional optional filter criteria boxes (marked in light blue). Each of the optional filter boxes contains a drop down list of field names which can be used to narrow down the amount of data to be included in the actual graph using additional filter fields.
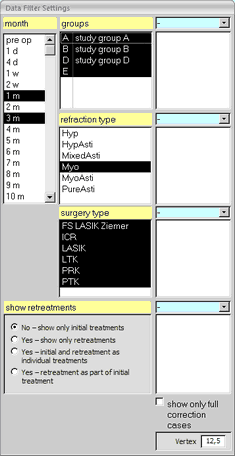
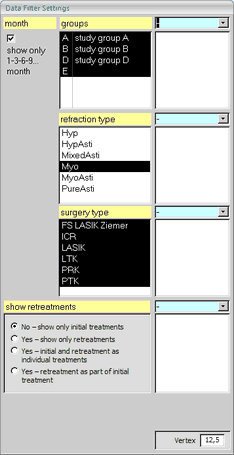
Note: Some of the filter options in this window may change, depending on the currently selected graph. Over time graphs will not show the 'month' selection area; trendline options will be seen only on scatter plots and wavefront based graphs have additional fields for wavefront type and pupil diameter.
Filtering is possible on the light yellow mandatory fields as well as up to 4 user defined optional filters. Currently (Version 5.20) there are 24 selectable filters. Once you have chosen an optional filter field, you will see a list of parameters, which depend on the content of your database.