|
Patient Population |
  
|
|
Patient Population |
|
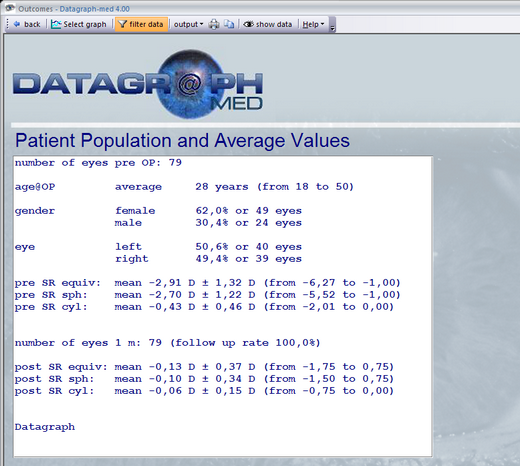
Datagraph-med calculates a summary of pre and postOP values which are usually given at the beginning of a presentation or in the abstract of a scientific work.
You may copy the text which appears in the white box into the clipboard and paste into any MS Office application.
Note: This 'graph' is not exported as MS Graph object and can be edited as normal text.